"Pooled Fund (2017 URS)" 2nd Year 3.34% (net) Gain.
Realizing 3.34% (net) yield, achieving consistent performances, Fidelibus Lucrum is delighted to announce results of "Pooled Fund (2017 URS)".
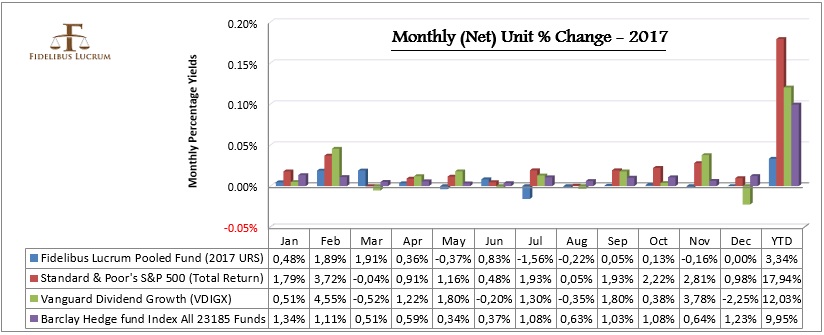
2017 proved to be a difficult year to produce any kind of extraordinary alpha as the markets entered a perpetual uptick with extremely low volatility and absolutely no cyclicality. The fund was mostly in cash with a very low participation rate (see below) and the small gains were won at the beginning of the year.
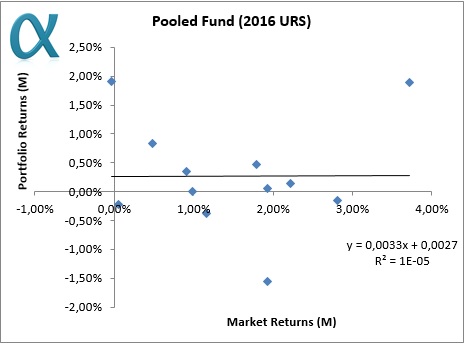
Fidelibus Lucrum our model was developed to outperform our peers equally in in down markets as well as in up markets with extremely low volatility risk in all market environments throughout the year.
Understanding The Statistics ?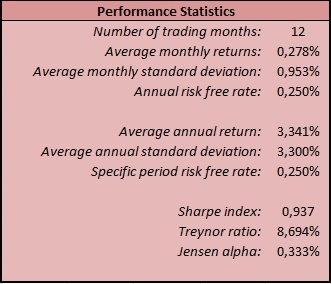
Trading Statistics
84 Total trades, averaging 75.00% profitable trades.
10.75 Average days in trades.
98 (65.77%) Winning v 51 (34.23%) Losing days.
33.33% Bullish v 1.28% Neutral v 65.38% Bearish trades (of which 1.28% were hedging).
7 Profitable months out of 11 (See data above).
3.34% Year end gains (3.21% using the Unit valuation accounting system (time weighted return).
Account net lick % used, Max 51.20% v Min 0.00%
Annual cash participation 10.55%

Understanding The Statistics ?
For more details register on the sites "Login Form" to obtain access to fund literature.
 The Manager, Fidelibus Lucrum, Pooled Investment Club.
31 December 2017. 20.11 Eastern.
"Pooled Fund (2016 URS)" Maiden Year 15.71% (net) Gain.
Realizing a solid 15.71% (net) yield, achieving an unprecedented performance, Fidelibus Lucrum is delighted to announce results of its maiden year "Pooled Fund (2016 URS)".
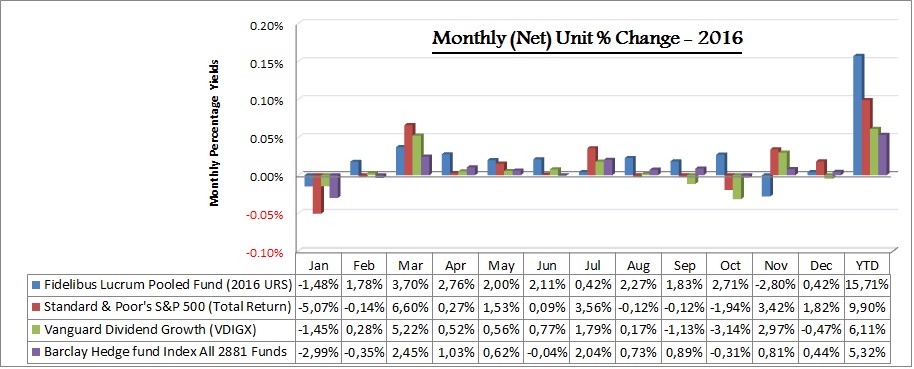
Comprehensively outperforming our benchmark S&P 500 Index (Total Return), and the Barclay Hedge Fund Index, as well as the much acclaimed Vanguard Dividend Growth Fund. The Vanguard Dividend Growth Fund was selected as a reference because it’s the one of the best performing funds available anywhere. The fund’s assets have nearly doubled during the last three years and it’s been so successful that Vanguard Is Closing This Incredibly Popular Fund to new Investors.
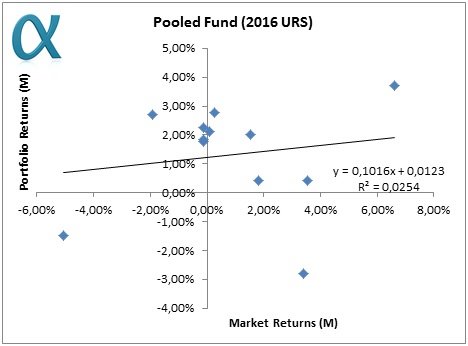
Fidelibus Lucrum results show the magnitude of the model developed outperforming its peers equally in down markets (January) as well as in up markets (February) right throughout the year.
Understanding The Statistics ?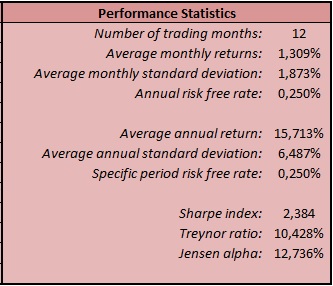
Trading Statistics
209 Total trades, averaging 71.71% profitable trades.
16.28 Average days in trades.
154 (61.60%) Winning v 96 (38.40%) Losing days.
27.61% Bullish v 20.15% Neutral v 52.24% Bearish trades (of which 2.24% were hedging).
10 Profitable months out of 12 (See data above).
15.71% Year end gains (16.67% using the Unit valuation accounting system (time weighted return).
Account net lick % used, Max 80.80% v Min 35.60%

Understanding The Statistics ?
For more details register on the sites "Login Form" to obtain access to fund literature.
 The Manager, Fidelibus Lucrum, Pooled Investment Club.
31 December 2016. 10.36 Eastern.
Defining Investment Management
Here at Fidelibus Lucrum we exercise Proactive Management, and in doing so put to bed the notion that the retail investor has no other options when investing other than Passive or Active Management.
Passive vs Active vs Proactive Management. Understanding investment management dynamics for the experienced investor isn't easy so imagine the confusion the retail investor must be experiencing. Presently we are made to believe that our sole options to investing is between passive or active portfolio management?. Today's unprecedented financial situation warrants the retail investor invests their time and effort to understand where their interests lie, indeed we argue that neither passive or active management is appropriate for today's economic environment.
Passive Investing The Unforeseen Dangers
Today we hear that Morningstar points out that many investors appear to be transitioning from actively managed mutual funds to passively managed funds, "The public may be losing interest, but it is not losing heart". Indeed the public's interest in passive funds has paved the way for a big rise in the number of financial indexes, according to a senior analyst at Sanford C. Bernstein & Co. We now have the bizarre situation that there are more indices than there are large cap stocks, clearly this explosion of investment vehicles is unsustainable.
Here at Fidelibus Lucrum we know investors have a short-term and fickle mentality when it comes to investing, back in the height of the financial crisis when the daily press printed alarming headlines like these.
U.K Banks Are Slashing Savers Deposit Rates
The Bank of England's move to cut benchmark interest rates last month has inflicted an earnings-headache for millions of U.K. savers as British banks slash rates across their retail portfolios. With the average rate on variable savings accounts now just 0.25 percent among major lenders, according to data from Citigroup Inc., British savers are earning less than inflation — which stood at 0.6 percent for July — amid a flurry of lender rate cuts across savings accounts, cash ISAs, and fixed-time deposits.
A “No Brainer”
So called financial experts tend to agree on one principle that retail investors are best served leaving their financial investments to the experts (Passive Investing) as these decisions are far too complex for the average individual investor to understand !!. Where the reality is there has never been a better time in the history of man for the individual investor to participate in what is the fairest, true and open market in the world the US stock market. Thanks to the internet and the technical revolution the retail investor is now equipped with all the knowledge and tools so he can now compete on an equal level with the institutional financial experts as like never before.
One could argue the scales have tipped in the retailer’s advantage,
- Smaller scales so much more nimble.
- Exposure, choosing size and participation (fund managers are reluctant to go to cash in fear of missing out and are often judged on their trading volumes).
- Selection of products (not having to participate in certain sectors or indexes because of fund prospectus).
- Smaller orders leading to better and quicker fills.
- Smaller portfolios with fewer positions easier and quicker to adjust.
- The freedom of choosing market direction (many fund managers have their hands tied and must maintain a positive delta portfolio).
The Maths
I’m feeling bullish on Tripadvisor (TRIP) and I want to initiate a long position so instead of buying 100 shares at $60.81 I decide to sell one September 17th 2016 (42 days) $60.00 put for a credit of $2.05. Should the stock be below $60.00 on expiration of the option then I will be put the stock at $60.00 so my cost basses will be reduced to $57.95. On the other hand should my bullish instincts be correct the stock closes above $60.00 then the put expires worthless and I keep the $2.05 earning 29.64% APR (Annual Percentage Rate) return on my investment (My investment being the maximum risk $57.95). This is a win win scenario that anybody with a basic education can do against common believe you don't need to be a seasoned fund manager to use strategies like these to make sustainable returns.
News Travels Fast
One would have to think that the word is already out in the street as more and more we see in the headlines “Hedge Funds Are Closing At A Fast Clip” Barron’s article March 21 2016, “How hedge-fund geniuses got beaten by monkeys — again” Market Watch article June 25, 2015, “Funds of Hedge Funds Shrink by 11% as Losses Spur Redemptions” Bloomberg article July 15, 2016.
Conclusion
The unprecedented quantitative easing has and will continue to force individual investors to take action and become active investors seeking alternatives out of necessity, this can only be a positive for society empowering individuals to take charge of their own destiny. All of this has been the primary inspiration for starting this Pooled Investment Club and once the results for the maiden evaluation year "Pooled Fund (2016 URS)" are published on this site on the 31th december 2016, it will be apparent why active investing is a “No Brainer”.
 The Manager, Fidelibus Lucrum, Pooled Investment Club.
07 August 2016. 11.15 Eastern.
Market Valuations
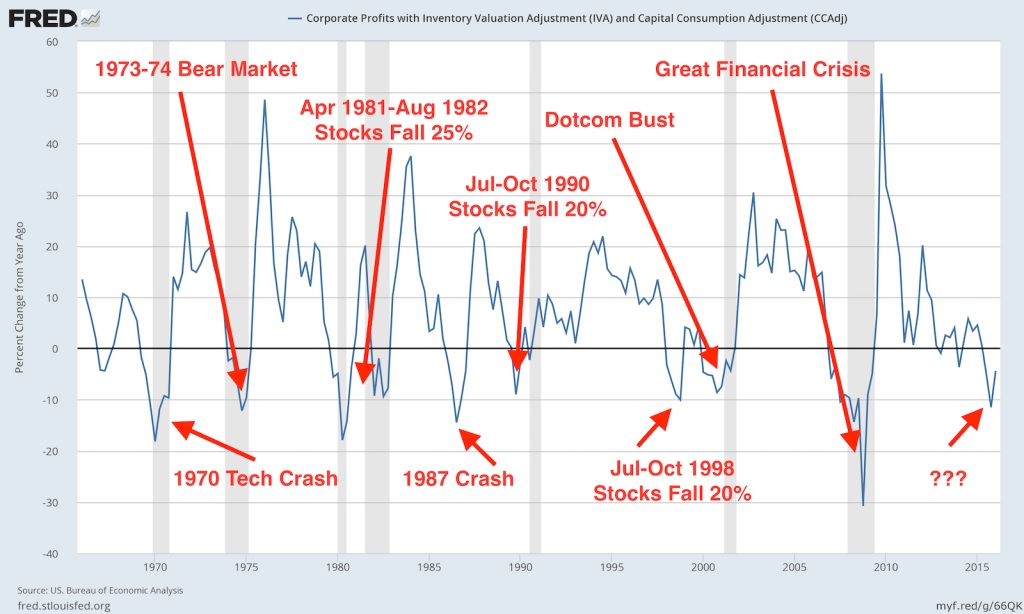
Earnnings season is well underway and the news isn't good, earnings have been caught in a downward spiral ever since profits peaked a year ago and the chart below illustrates an ominous trend. Since the last 50 years whenever earnings dipped below -10% (as we are now) the market undergone a major correction of least a 20%.
 2016 presidential election
Adding to the drag on the market is the upcomming US elections which tend to be historically negative to the market (when electors must select a new leader) as in this election, and now the R (recession) word on so many lips, all in all a cautious approach is probably the most prudent for the next few months at least.
Dick Van Winkle
Some may argue that things are different this time the feds obsession to keep the leaking ship afloat at all price and they will probably be correct in thinking so, but just as in the Dutch mythical story of a small boy “Dick Van Winkle” passing a dyke on his way to school noticed a slight leak as the sea trickled in through the small hole. The boy poked his finger into the hole and so stemmed the flow of water knowing “a small trickle of water soon becomes a stream and the stream a torrent and the torrent a flood sweeping all before it”
 The Manager, Fidelibus Lucrum, Pooled Investment Club.
24 July 2016. 09.30 Eastern.
Subcategories
Fidelibus Lucrum Social Media Postings
This is Social Media Postings for site public.


